Exploring Facebook 2019 533M Leaked Data with Python and Pandas
Data Science
Data Analysis
Data Visualization
Exploratory Data Analysis
Author
Daniel Fat
Published
May 4, 2020
Code
import osimport pandas as pdimport numpy as npfrom IPython.core.display import display, HTMLimport plotly.graph_objects as gofrom plotly.subplots import make_subplotsimport matplotlib.pyplot as pltimport seaborn as snsimport pycountryplt.style.use('seaborn')
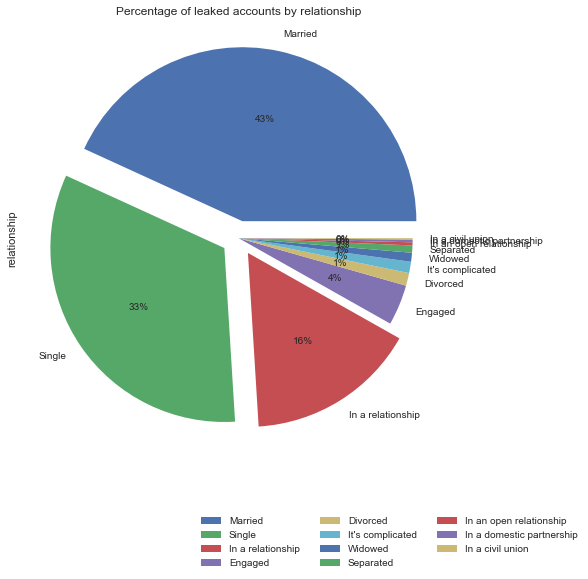
usa.relationship.value_counts().plot.pie(autopct='%1.0f%%',title='Percentage of leaked accounts by relationship',figsize=(8,8),explode=(0.1,0.1,0.1,0,0,0,0,0,0,0,0)).legend(bbox_to_anchor=(1.3,-0.12),ncol=3);
usa.email.isnull().value_counts().rename({True:'Missing',False:'Found'}).plot.pie(autopct='%1.0f%%',title='Percentage of missing email addresses');plt.ylabel('');
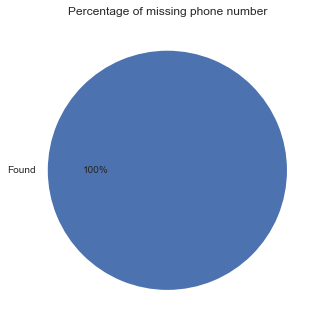
Percentage of missing values in phone number
Code
usa.phone_no.isnull().value_counts().rename({True:'Missing',False:'Found'}).plot.pie(autopct='%1.0f%%',title='Percentage of missing phone number');plt.ylabel('');
UK
Code
uk = pd.read_feather(os.path.join(path_to_data,'uk/uk.feather'))uk.columns
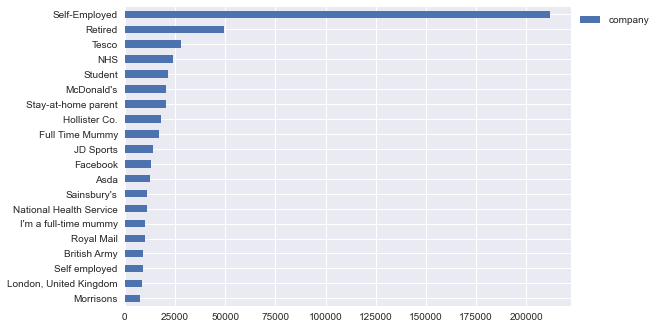
uk.relationship.value_counts().plot.pie(autopct='%1.0f%%',title='Percentage of leaked accounts by relationship',figsize=(8,8),explode=(0.1,0.1,0.1,0,0,0,0,0,0,0,0)).legend(bbox_to_anchor=(1.3,-0.12),ncol=3);plt.ylabel('');
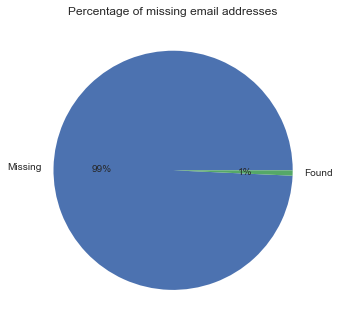
uk.email.isnull().value_counts().rename({True:'Missing',False:'Found'}).plot.pie(autopct='%1.0f%%',title='Percentage of missing email addresses');plt.ylabel('');
Percentage of missing values in phone number
Code
uk.phone_no.isnull().value_counts().rename({True:'Missing',False:'Found'}).plot.pie(autopct='%1.0f%%',title='Percentage of missing phone number');plt.ylabel('');
Conclusions
Not many email addresses found in the data, however there is no missing phone number
Using the user_id we can easily access the user profile https://facebook.com/{user_id}