Code
try:
  import faster_than_requests as req
except:
  !pip install faster-than-requests
  import faster_than_requests as req
We use faster-than-requests becaue is new, fast and fancy
try:
import faster_than_requests as req
except:
!pip install faster-than-requests
import faster_than_requests as reqwe upgrade gensim at this point we we won’t have to restart the runtime after we get the data in
!pip install --upgrade gensimHere we import the packages we need, good to know we use fake_useragent to change the User-Agent in the header of each request to make it look like IE7. Thus it will force Twitter to go into the old web version without the web component based front-end and easy to crawl
import pandas as pd
import numpy as np
from matplotlib import pyplot as plt
from bs4 import BeautifulSoup
try:
  from fake_useragent import UserAgent
except:
  !pip install fake_useragent
  from fake_useragent import UserAgent
from os.path import exists
import urllib.parse
More utils which are going to be used later, please use TF <=2.0
from gensim.utils import simple_preprocess
import tensorflow as tf
import tensorflow_hub as hub
from sklearn.metrics.pairwise import cosine_similarity
import networkx as nx
from wordcloud import WordCloud
import nltk
nltk.download('stopwords')
nltk.download('punkt')
from nltk.corpus import stopwords
from nltk.tokenize import word_tokenize
from nltk.tokenize import RegexpTokenizer
[nltk_data] Downloading package stopwords to /root/nltk_data...
[nltk_data] Package stopwords is already up-to-date!
[nltk_data] Downloading package punkt to /root/nltk_data...
[nltk_data] Package punkt is already up-to-date!Here is the fancy trick with the user agent
req.set_headers([
    ('User-Agent', UserAgent().ie)
])
So here we have:
twitter_selectors a dictionary with the css selectors for each tweet
get_soup is sending a get request to get the html content from the url right into the BeautifulSoup html parser creating a object which I call soup
get_tweets is using a soup to extract the username and content of each tweet
get_tweets_df finally this function is using all functions from above into a loop to mine all the tweets and returning a pandas dataframe
twitter_selectors = {
    'post': '.tweet',
#    'full_name': '.fullname',
    'username': '.username',
    'content': '.tweet-text'

}

def get_soup(url):
    return BeautifulSoup(req.get2str(url),'html.parser')

def get_tweets(soup):
    tweets = list()
    for tweet in soup.select(twitter_selectors.get('post')):
        tweets.append({
                'username': tweet.select_one(twitter_selectors.get('username')).text,
                'content': tweet.select_one(twitter_selectors.get('content')).text,
        })

    return tweets

def get_tweets_df(keyword,limit=None):
    url = f'https://mobile.twitter.com/search?q={urllib.parse.quote_plus(keyword)}'
    tweets = []
    stop = False
    while(stop != True):
        try:
          soup = get_soup(url=url)
          tweets+=get_tweets(soup=soup)
          next = soup.select_one('.w-button-more a')
          if next:
              url = 'https://mobile.twitter.com' + next['href']
          else:
              stop = True
        except:
          continue

        if limit != None and limit <= tweets.__len__():
          stop = True


    print(f'{tweets.__len__()} tweets has been crawled')
    return pd.DataFrame.from_dict(tweets)
Then we call it with a 1000 tweets limit to get all the tweets for the related topic, in our case coronavirus. Since we are mining by tweets/page we get a few more tweets.
%%time
df = get_tweets_df('coronavirus',limit = 1000)
1015 tweets has been crawled
CPU times: user 2.45 s, sys: 43.4 ms, total: 2.5 s
Wall time: 27.5 sFurther on we use this lambda function to remove any breakline @ and #
df = df.apply(lambda x: x.str.replace('\n','').replace('@','').replace('#',''),axis=1)Now we use this Universal Sentence Encoder to get the sentence embeddings from the tweets content
embd = hub.load(f"https://tfhub.dev/google/universal-sentence-encoder/4")
def embed(sentences):
  return np.array(embd(tf.squeeze(tf.cast(sentences, tf.string))))
We save it as a column
df['content_sent_vects'] = embed(df.content.values).tolist()df| username | content | content_wordlist | content_sent_vects | |
|---|---|---|---|---|
| 0 | @allkpop | Jaejoong facing possible punishment by KCDC ... | NaN | [-0.07023757696151733, 0.04490802809596062, -0... |
| 1 | @Corona_Bot__ | CONFIRMED: Barney tests positive for Coronav... | NaN | [0.05011240020394325, -0.031166449189186096, -... |
| 2 | @nytimes | The Korean star known as Jaejoong of the K-p... | NaN | [-0.01596658118069172, 0.04994076490402222, 0.... |
| 3 | @PIB_India | Approx 1800 people related to #TablighJamaat... | NaN | [-0.06460247933864594, 0.05959327518939972, -0... |
| 4 | @SkyNews | Coronavirus: Woman fined £650 for refusing t... | NaN | [-0.05083870142698288, 0.03122670203447342, 0.... |
| ... | ... | ... | ... | ... |
| 1010 | @ASlavitt | Andy Slavitt: slowing spread of coronavirus ... | NaN | [0.02724810130894184, -0.002946038730442524, 0... |
| 1011 | @fred_guttenberg | Many reasons that I wish @JoeBiden were Pres... | NaN | [0.04280007258057594, -0.05422208085656166, 0.... |
| 1012 | @FOXLA | Coronavirus droplets could travel 27 feet, wa... | NaN | [0.03585874289274216, 0.06049816682934761, 0.0... |
| 1013 | @joncoopertweets | Fox News purportedly bracing for “legal bloo... | NaN | [0.03799957036972046, 0.0289924293756485, -0.0... |
| 1014 | @NBCLatino | On #CesarChavezDay, Democratic presidential ... | NaN | [0.020493853837251663, 0.03346347063779831, 0.... |
1015 rows × 4 columns
More packages
from gensim.models import Phrases
from gensim.models.phrases import Phraser
import spacy
import gensim.corpora as corpora
from gensim.models.ldamodel import LdaModel
from pprint import pprint
from gensim.models import CoherenceModel
from gensim.models.wrappers import LdaMallet
from os.path import exists
import requests, zipfile, io
import os
I’ve put together a class following this tutorial to handler easier the LDA model, still having some issues with the mallet model inside of the colab, but I guess I will try to sort that out later
Nothing very fancy here, just building and storing everytning in a class, as further on we might need to reuse bigrams or trigrams. It is not the best approach as it is using loads of other packages inside so passing arugments into a constructor to initialise or change each module parameters might be pain so for the moment we will stick with this configuration and hopefully we can find a fast way to work with the mallet model.
class LDA:

  def __init__(self,sentences,mallet=False):
      self.sentences = sentences
      self.bigram = Phrases(self.sentences, min_count=5, threshold=100) # higher threshold fewer phrases.
      self.trigram = Phrases(self.bigram[self.sentences], threshold=100)
      self.bigram_mod = Phraser(self.bigram)
      self.trigram_mod = Phraser(self.trigram)
      self.stop_words = stopwords.words('english')
      self.nlp = spacy.load('en', disable=['parser', 'ner'])
      self.download_mallet_path = 'http://mallet.cs.umass.edu/dist/mallet-2.0.8.zip'
      self.mallet_path = '/content/mallet-2.0.8/bin/mallet'
      self.ldamallet = None
      self.ldamallet = None
      self.topics = None
      self.java_installed = False

      os.environ['MALLET_HOME'] = '/content/mallet-2.0.8'


      ######################
      self.make()

      # if mallet:
      #   self.build_ldamallet()
      # else:
      #   self.build_lda()
      ######################

  def remove_stopwords(self):
      self.sent_no_stops =  [[word for word in simple_preprocess(str(doc)) if word not in self.stop_words] for doc in self.sentences]

  def make_bigrams(self):
      self.bigram_data = [self.bigram_mod[doc] for doc in self.sent_no_stops]

  def make_trigrams(self):
      self.trigram_data = [self.trigram_mod[self.bigram_mod[doc]] for doc in self.sent_no_stops]

  def lemmatization(self, allowed_postags=['NOUN', 'ADJ', 'VERB', 'ADV']):
      self.lemm_sentences = [ [token.lemma_ for token in self.nlp(" ".join(sent)) if token.pos_ in allowed_postags] for sent in self.bigram_data]

  def dictionary(self):
      self.id2word = corpora.Dictionary(self.lemm_sentences)

  def corpus(self):
      self.corpus = [self.id2word.doc2bow(text) for text in self.lemm_sentences]

  def make(self):
      self.remove_stopwords()
      self.make_bigrams()
      self.make_trigrams()
      self.lemmatization()
      self.dictionary()
      self.corpus()

  def build_lda(self,num_topics=20,random_state=100,update_every=1,chunksize=100,passes=10,alpha='auto'):
      self.lda_model = LdaModel(
                      corpus=self.corpus,
                      id2word=self.id2word,
                      num_topics=num_topics,
                      random_state=random_state,
                      update_every=update_every,
                      chunksize=chunksize,
                      passes=passes,
                      alpha=alpha,
                      per_word_topics=True)


  def download_mallet(self):
      r = requests.get(self.download_mallet_path)
      z = zipfile.ZipFile(io.BytesIO(r.content))
      z.extractall()

      if not self.java_installed:
        self.install_java()


  def install_java(self):
      !apt-get install -y openjdk-8-jdk-headless -qq > /dev/null      #install openjdk
      os.environ["JAVA_HOME"] = "/usr/lib/jvm/java-8-openjdk-amd64"     #set environment variable
      !java -version       #check java version


  def build_ldamallet(self,num_topics=20):
      if not exists(self.mallet_path):
        self.download_mallet()
      self.ldamallet = LdaMallet(self.mallet_path, corpus=self.corpus, num_topics=num_topics, id2word=self.id2word)

  def coherence_score(self,mallet=False):
      if mallet:
        pprint(self.ldamallet.show_topics(formatted=False))
        md = self.ldamallet
      else:
        md = self.lda_model
        pprint(self.lda_model.print_topics())


      coherence_model = CoherenceModel(model=md, texts=self.lemm_sentences, dictionary=self.id2word, coherence='c_v')
      coh = coherence_model.get_coherence()
      print('\nCoherence Score: ', coh)


  def compute_coherence_values(self, limit, start=2, step=3, mallet=False):
      coherence_values = []

      for num_topics in range(start, limit, step):
          if mallet:
            self.build_ldamallet(num_topics=num_topics)
            md = self.ldamallet
          else:
            self.build_lda(num_topics=num_topics)
            md = self.lda_model
          coherencemodel = CoherenceModel(model=md, texts=self.lemm_sentences, dictionary=self.id2word, coherence='c_v')
          coherence_values.append({
              'num_topics': num_topics,
              'coherence': coherencemodel.get_coherence()
          })

      return coherence_values
We create an object of our LDA class and passing the raw sentences as a list. Then we compute a coherence search for the best number of topics related to our content. However since those tweets are mined, this process might have different results on each new data.
%%time
ld = LDA(df.content.values.tolist())
ld_coherence_values = ld.compute_coherence_values(start=2, limit=40, step=6)
pprint(ld_coherence_values)
[{'coherence': 0.24454476285561758, 'num_topics': 2},
{'coherence': 0.46119096489624833, 'num_topics': 8},
{'coherence': 0.4516224532223637, 'num_topics': 14},
{'coherence': 0.42736241847827366, 'num_topics': 20},
{'coherence': 0.3930428008422175, 'num_topics': 26},
{'coherence': 0.4105924951482943, 'num_topics': 32},
{'coherence': 0.39407950264156383, 'num_topics': 38}]
CPU times: user 34.9 s, sys: 183 ms, total: 35.1 s
Wall time: 35.2 sFrom the previous search we found the best number of topics, which now we are using to rebuild the model and show the topics we found.
ld.build_lda(num_topics=8)
ld.lda_model.print_topics()
[(0,
'0.148*"com" + 0.075*"twitter" + 0.061*"pic" + 0.046*"virus" + 0.032*"go" + 0.026*"people" + 0.022*"corona" + 0.018*"test" + 0.018*"make" + 0.018*"day"'),
(1,
'0.026*"would" + 0.025*"fight" + 0.021*"die" + 0.019*"watch" + 0.018*"turn" + 0.017*"hard" + 0.016*"leader" + 0.016*"thank" + 0.013*"presidential" + 0.013*"bar"'),
(2,
'0.036*"week" + 0.027*"tell" + 0.023*"see" + 0.019*"official" + 0.018*"tough" + 0.017*"break" + 0.015*"story" + 0.015*"worker" + 0.014*"end" + 0.014*"good"'),
(3,
'0.025*"shift" + 0.022*"use" + 0.018*"slow" + 0.017*"do" + 0.017*"state" + 0.016*"company" + 0.015*"truth" + 0.015*"crisis" + 0.015*"few" + 0.015*"time"'),
(4,
'0.037*"say" + 0.031*"today" + 0.029*"doctor" + 0.028*"many" + 0.028*"want" + 0.024*"nurse" + 0.021*"work" + 0.015*"can" + 0.013*"american" + 0.012*"job"'),
(5,
'0.069*"trump" + 0.027*"country" + 0.017*"tirelessly" + 0.016*"join" + 0.016*"term" + 0.014*"enemy" + 0.014*"view" + 0.013*"concerned" + 0.013*"republican" + 0.012*"nation"'),
(6,
'0.055*"case" + 0.053*"death" + 0.043*"new" + 0.021*"spread" + 0.021*"high" + 0.018*"back" + 0.017*"call" + 0.016*"important" + 0.014*"look" + 0.013*"country"'),
(7,
'0.031*"incredible" + 0.029*"say" + 0.025*"warn" + 0.024*"rather" + 0.023*"report" + 0.020*"could" + 0.020*"bravery" + 0.016*"force" + 0.016*"think" + 0.016*"care"')]We use the cosine similarity on the extracted vectors to create a similarity matrix
%%time
similarity_matrix = cosine_similarity(df.content_sent_vects.values.tolist())
CPU times: user 2.88 s, sys: 150 ms, total: 3.03 s
Wall time: 1.96 sWe put this together into a dataframe with the username as columns and index thus it will look quite similar with a correlation dataframe or heatmap
simdf = pd.DataFrame(
    similarity_matrix,
    columns = df.username.values.tolist(),
    index = df.username.values.tolist()
)
However we want this unstacked to make make it easier to pass into our graph, also we’ve kept just the username as each one is unique
So here you can see the similarity between the content of each user
long_form = simdf.unstack()
# rename columns and turn into a dataframe
long_form.index.rename(['t1', 't2'], inplace=True)
long_form = long_form.to_frame('sim').reset_index()
long_form = long_form[long_form.t1 != long_form.t2]
long_form[:3]| t1 | t2 | sim | |
|---|---|---|---|
| 1 | @AdamSchefter | @NorbertElekes | 0.133930 |
| 2 | @AdamSchefter | @BreitbartNews | 0.295476 |
| 3 | @AdamSchefter | @DarylDust | 0.150086 |
Here we want to select the similarity treshold to filter the tweets and create our graph from the formatted dataframe
sim_weight = 0.95
gdf = long_form[long_form.sim > sim_weight]
plt.figure(figsize=(25,25))
pd_graph = nx.Graph()
pd_graph = nx.from_pandas_edgelist(gdf, 't1', 't2')
pos = nx.spring_layout(pd_graph)
nx.draw_networkx(pd_graph,pos,with_labels=True,font_size=10,font_color='#fff',edge_color='#f00',node_size = 30)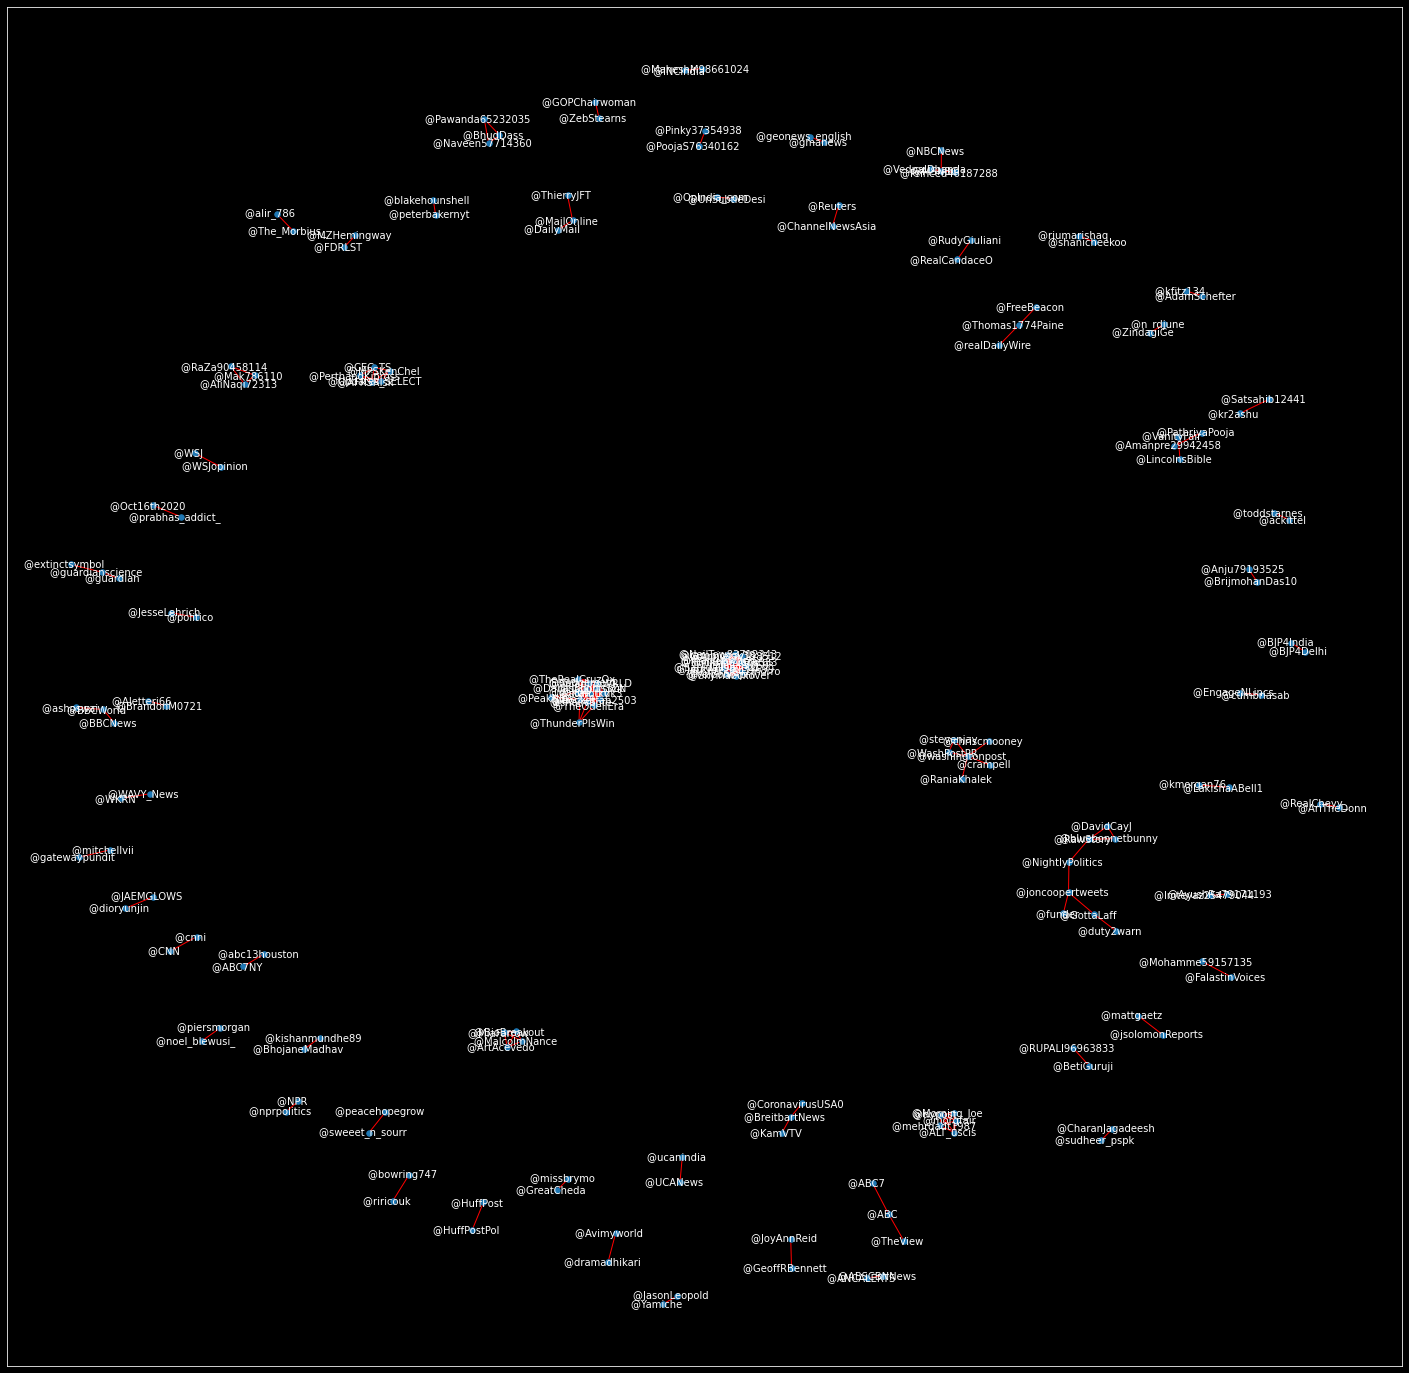
Now we get the connected components into a dataframe
l=list(nx.connected_components(pd_graph))

L=[dict.fromkeys(y,x) for x, y in enumerate(l)]

d=[{'users':k , 'groups':v }for d in L for k, v in d.items()]gcd = pd.DataFrame.from_dict(d)Here is the number of groups or clusters we have extracted for the chosen similarity treshold
gcd.groups.nunique()65We add the content for each user into the grouped dataframe
gcd['content'] = gcd.users.apply(lambda x: df[df.username==x].content.values.tolist()[0] )
gcd[:5]| users | groups | content | |
|---|---|---|---|
| 0 | @AdamSchefter | 0 | Cardinals All-Pro linebacker Chandler Jones ... |
| 1 | @kfitz134 | 0 | Cardinals All-Pro linebacker Chandler Jones ... |
| 2 | @Aletteri66 | 1 | The Corona virus can’t kill me because I alr... |
| 3 | @BrandonM0721 | 1 | The Corona Virus can’t kill me, I already di... |
| 4 | @realDailyWire | 2 | Epidemiologist Behind Highly-Cited Coronavir... |
We use a nltk tokenizer to extract just the words and remove the stop words
tok = RegexpTokenizer(r'\w+')
stop_words = set(stopwords.words('english'))
def clean(string):
    return " ".join([w for w in word_tokenize(" ".join(tok.tokenize(string))) if not w in stop_words])

gcd.content = gcd.content.apply(lambda x: clean(x))
[nltk_data] Downloading package stopwords to /root/nltk_data...
[nltk_data] Package stopwords is already up-to-date!
[nltk_data] Downloading package punkt to /root/nltk_data...
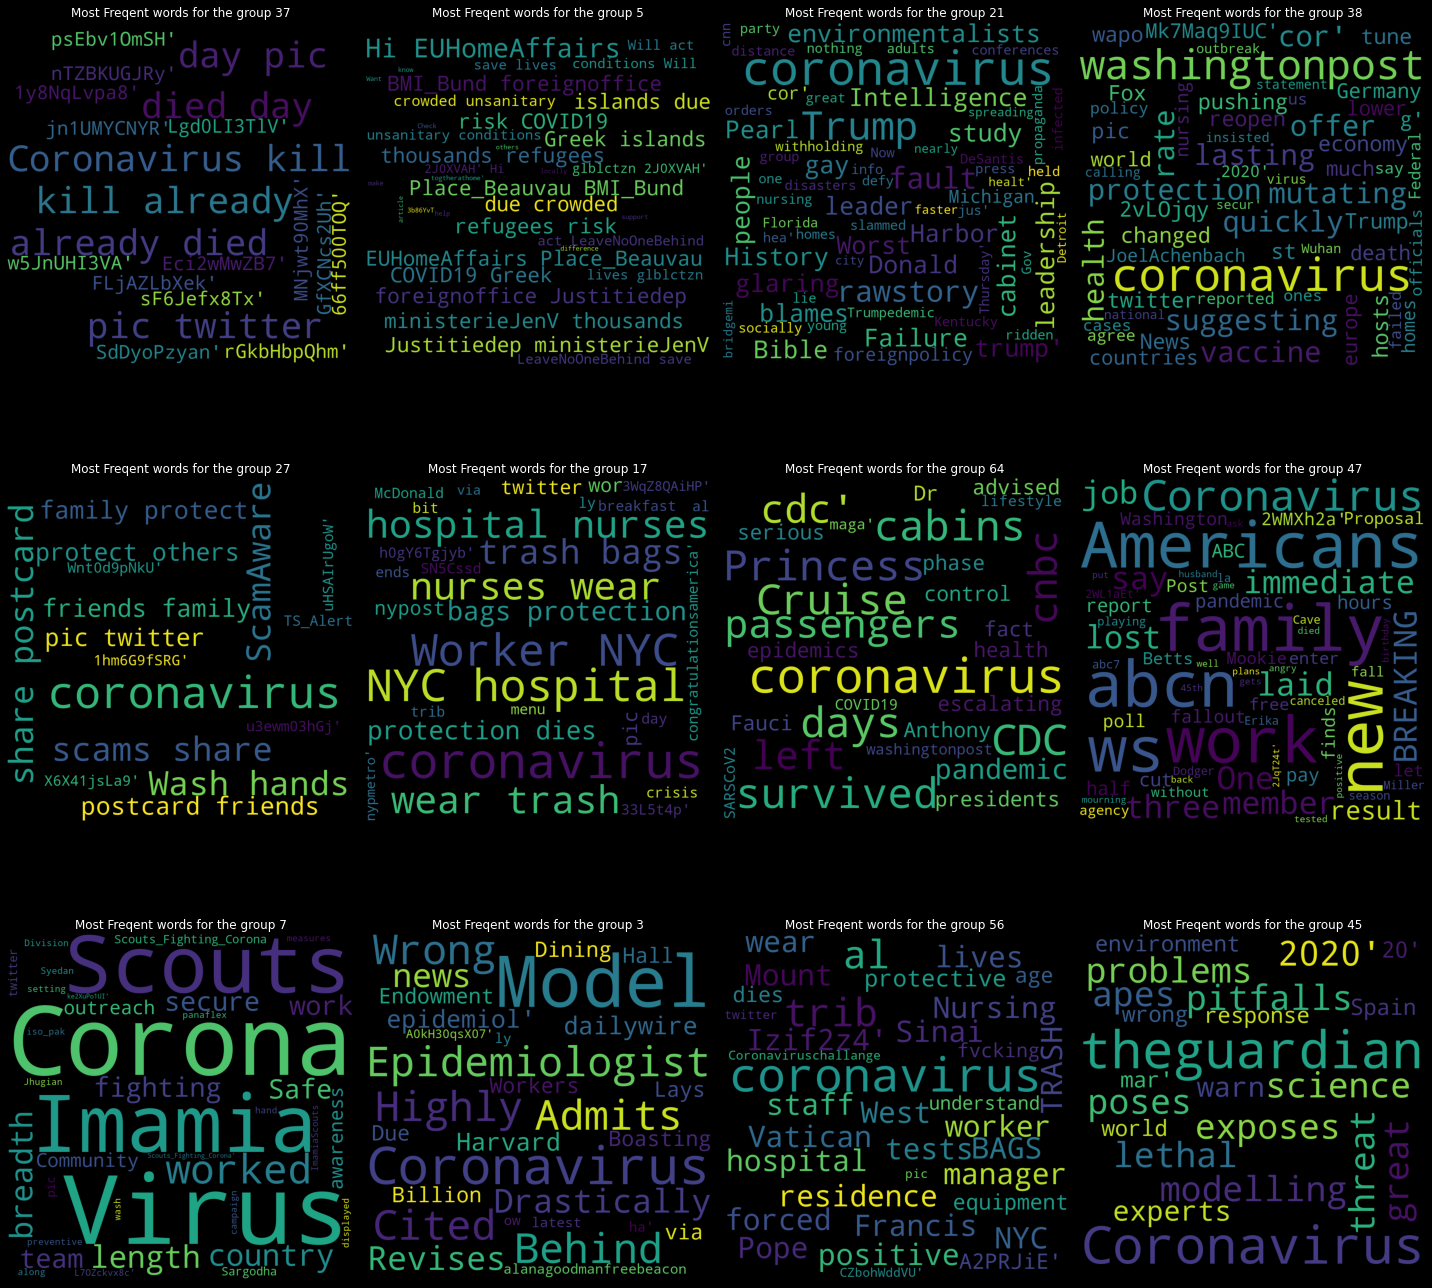
[nltk_data] Package punkt is already up-to-date!Our big_groups is a list of indexes from our grouped dataset with the index of the top 12 groups sorted descending.
Then we iterate through these indexes and create WordCloud of each group whihc is stored in the clouds dictionary
%%time
clouds = dict()

big_groups = pd.DataFrame({
    'counts':gcd.groups.value_counts()
    }).sort_values(by='counts',ascending=False)[:12].index.values.tolist()

for group in big_groups:
    text = gcd[gcd.groups == group].content.values
    wordcloud = WordCloud(width=1000, height=1000).generate(str(text))
    clouds[group] = wordcloud
CPU times: user 28.7 s, sys: 581 ms, total: 29.3 s
Wall time: 29.4 sdef plot_figures(figures, nrows = 1, ncols=1):
fig, axeslist = plt.subplots(ncols=ncols, nrows=nrows,figsize=(20,20))
for ind,title in zip(range(len(figures)), figures):
axeslist.ravel()[ind].imshow(figures[title], cmap=plt.jet())
axeslist.ravel()[ind].set_title(f'Most Freqent words for the group {title+1}')
axeslist.ravel()[ind].set_axis_off()
plt.tight_layout() # optionalThen we plot them with the help of our plot_figures function
plt.style.use("dark_background")
plot_figures(clouds, 3, 4)
plt.show()